RUNNING TESTS
Test Reports
Generate detailed test reports in multiple formats for debugging, CI/CD integration, and performance analysis. Karate provides comprehensive reporting out of the box.
Every pattern on this page is available as a live example in karate-todo, published to GitHub Pages on every green build:
- karate-summary.html — the main dashboard, with interactive tag filtering
- karate-timeline.html — parallel execution Gantt
- simple.feature with embedded screenshots — a UI scenario's request trace + inline PNGs
- Gatling report — performance summary
See CI/CD for the GitHub Actions workflow that publishes these.
Report Formats
| Format | On by default | How to enable | What it's for |
|---|---|---|---|
| HTML | yes | (default) | Local debugging, sharing test runs |
| JSON Lines | no | outputJsonLines(true) / -f karate:jsonl | CI/CD scraping, sharded-run aggregation, the canonical structured feed |
| Cucumber JSON | no | outputCucumberJson(true) / -f cucumber:json | Third-party dashboards (Allure, etc.) |
| JUnit XML | no | outputJunitXml(true) / -f junit:xml | Test management tools (Xray, Zephyr, qTest, TestRail, ReportPortal) |
To turn off HTML, pass outputHtmlReport(false) or -f ~html.
HTML reports (default)
Rich, interactive reports for development and debugging:
- Request/response with full bodies — complete HTTP interaction including headers and JSON bodies, captured automatically. You don't need to crank the log level: bodies always land in HTML at the default
report: 'debug'threshold. See Logging for the why. - Step-by-step execution — visual test flow with timing
- Inline debugging —
printstatements and variable values, with JSON syntax highlighting - Screenshots and embeds — automatic UI test captures plus arbitrary HTML/image embeds via
karate.embed() - Timeline visualization — Gantt-style thread utilization analysis (
karate-timeline.html) - Dark mode — Tailwind-based UI with a light/dark theme toggle
- Tag filtering — interactive tag-based filtering in the dashboard
The summary dashboard opens on a pass/fail chart with totals and a failures panel:
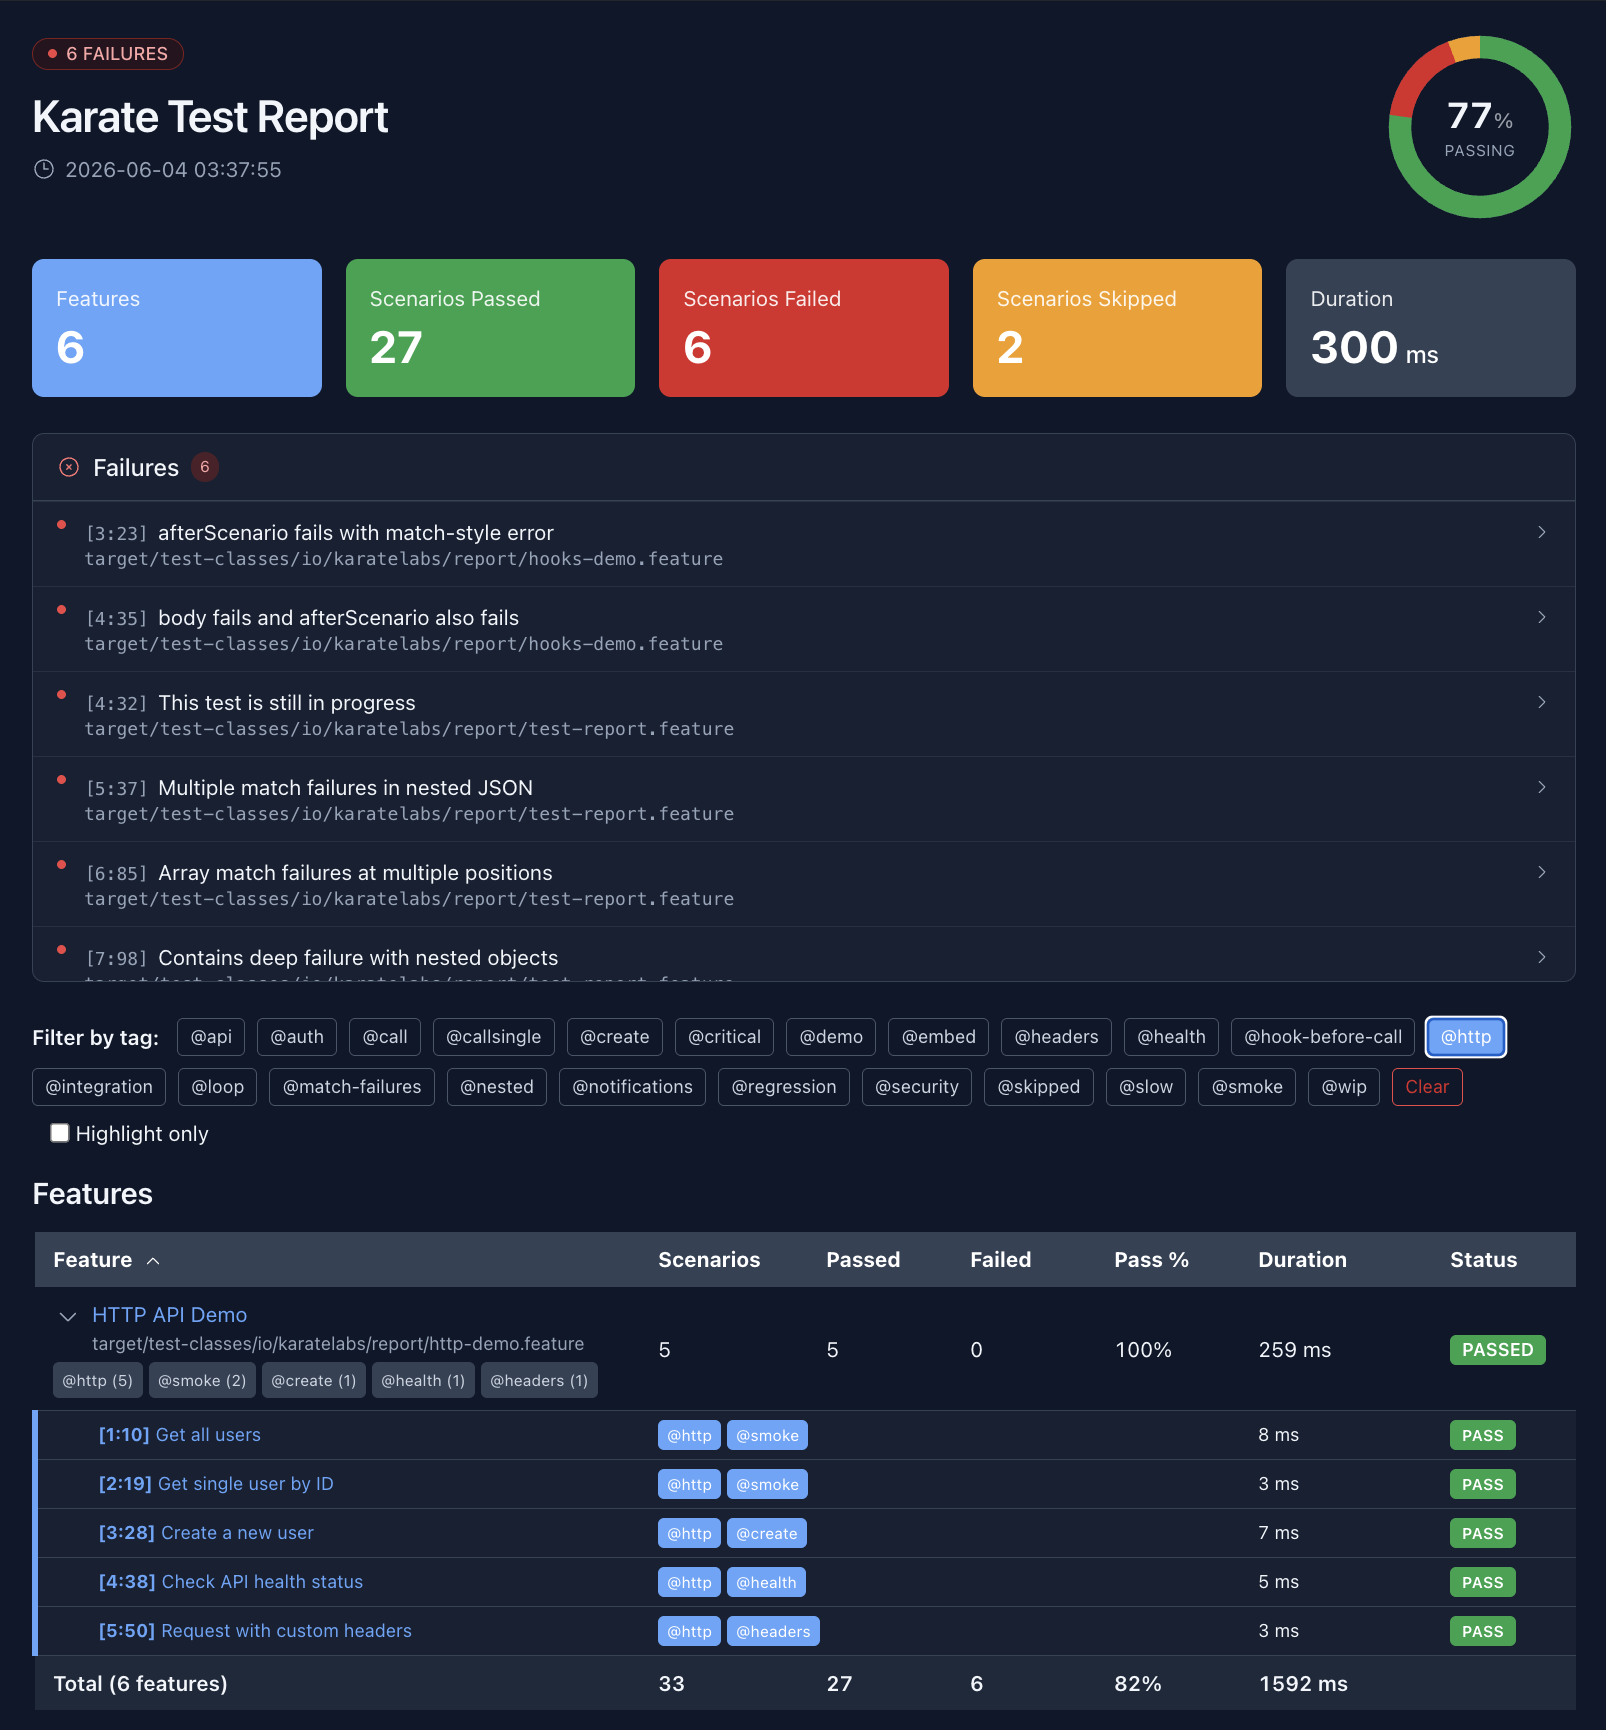
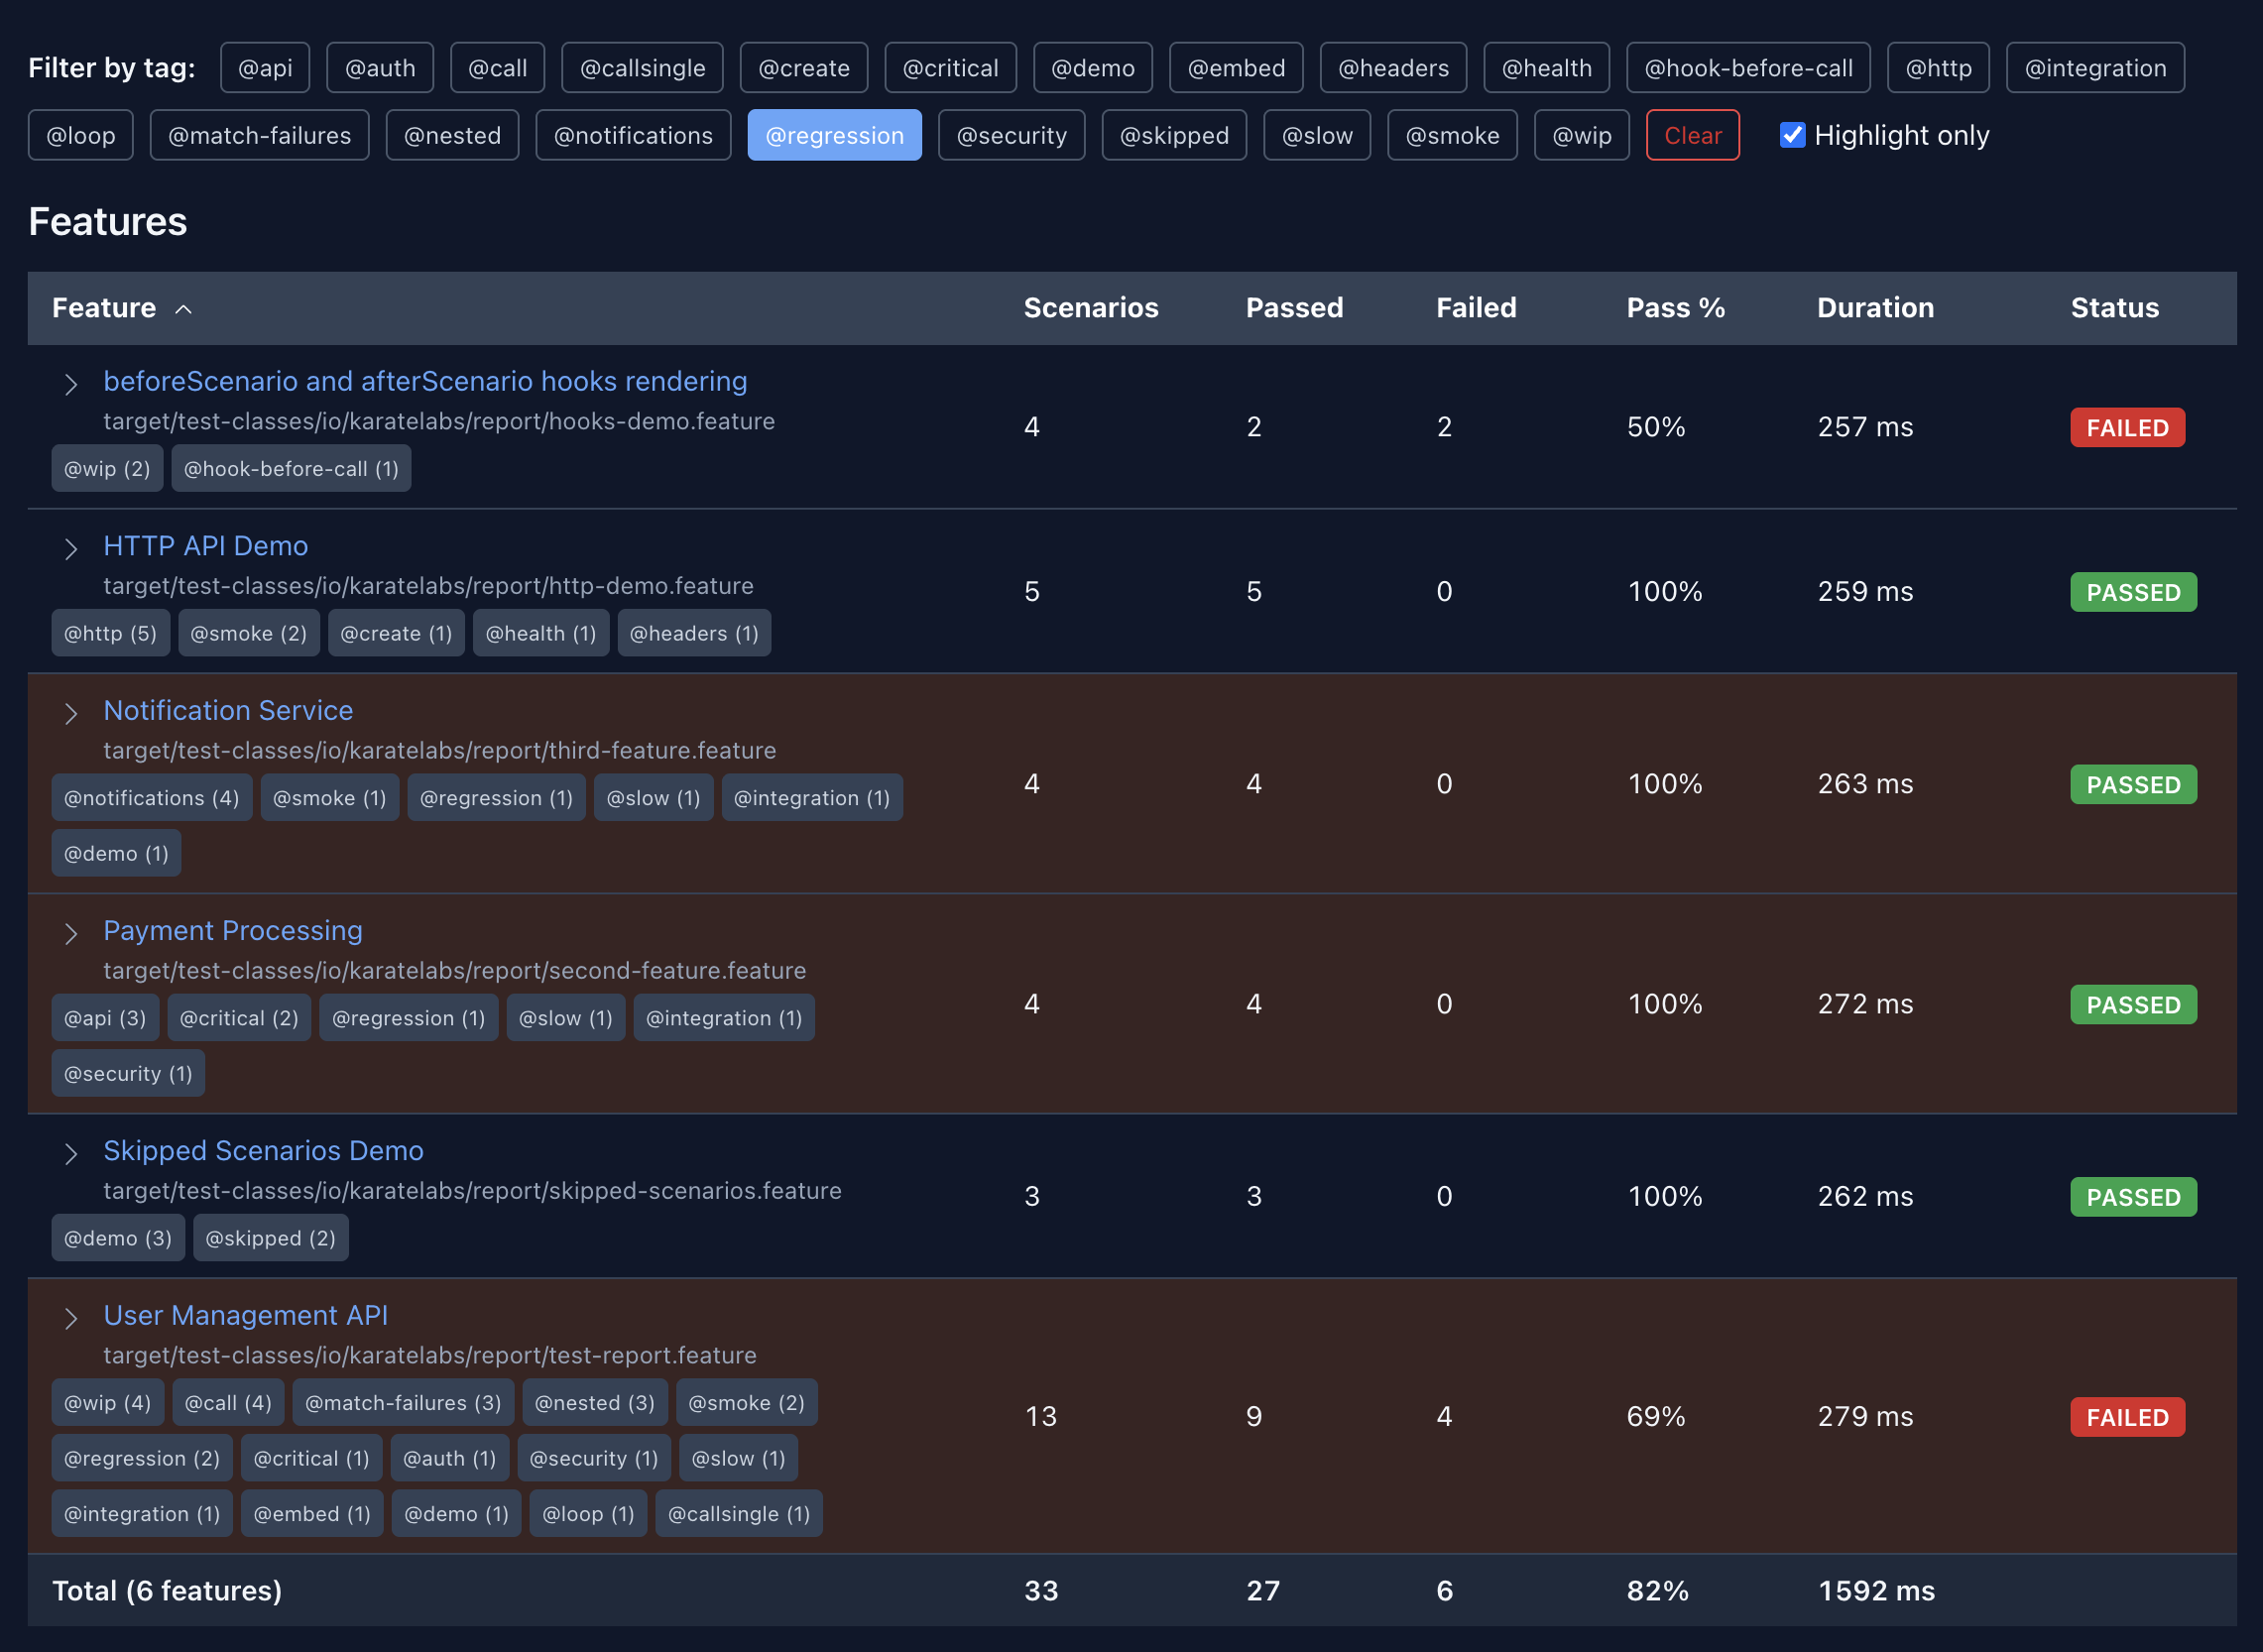
Tag chips filter the feature list — pick a tag to narrow it, or toggle Highlight only to keep every feature visible and just highlight the matches:
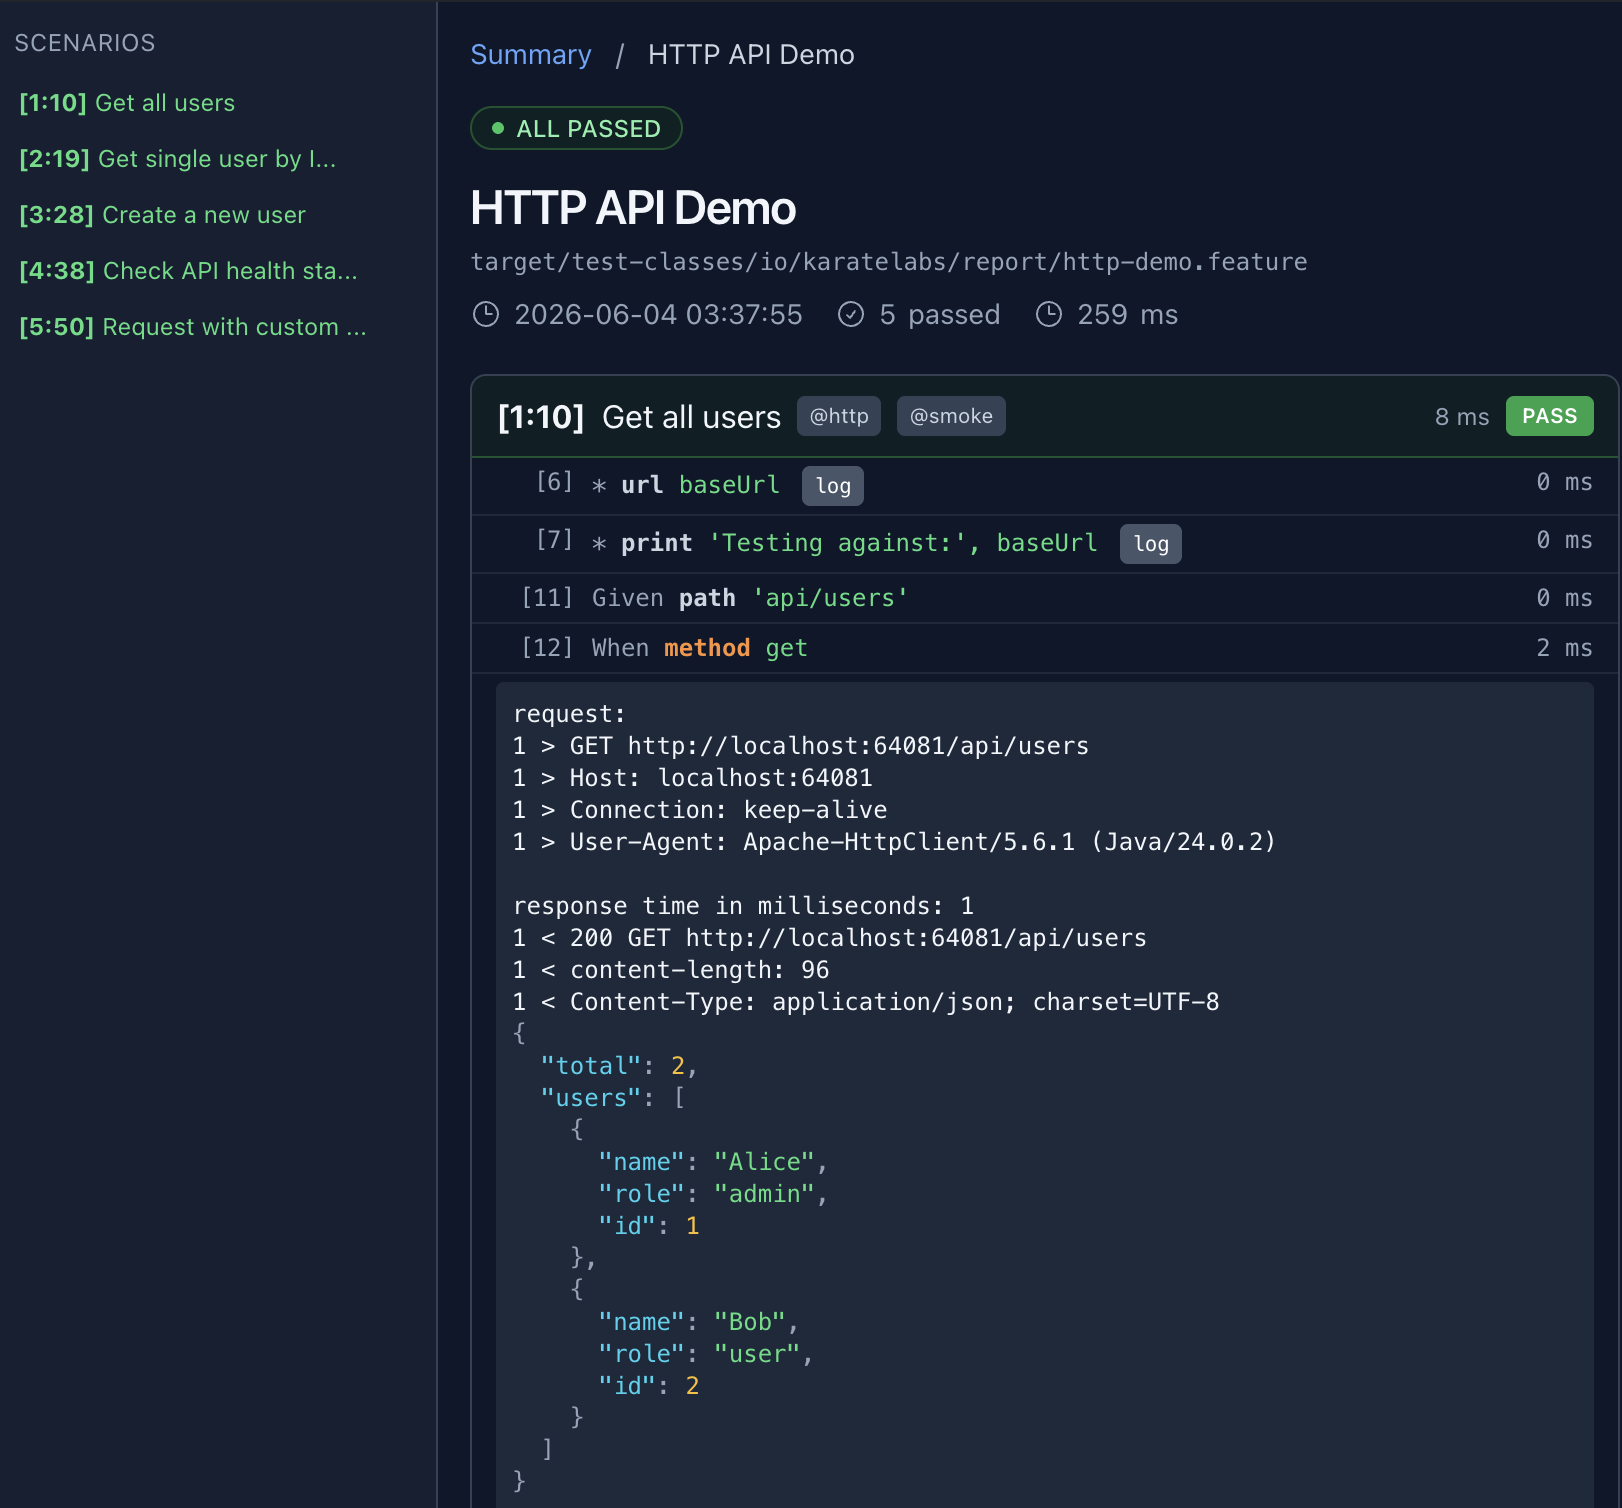
Drilling into a feature shows each step's request/response with JSON syntax highlighting:
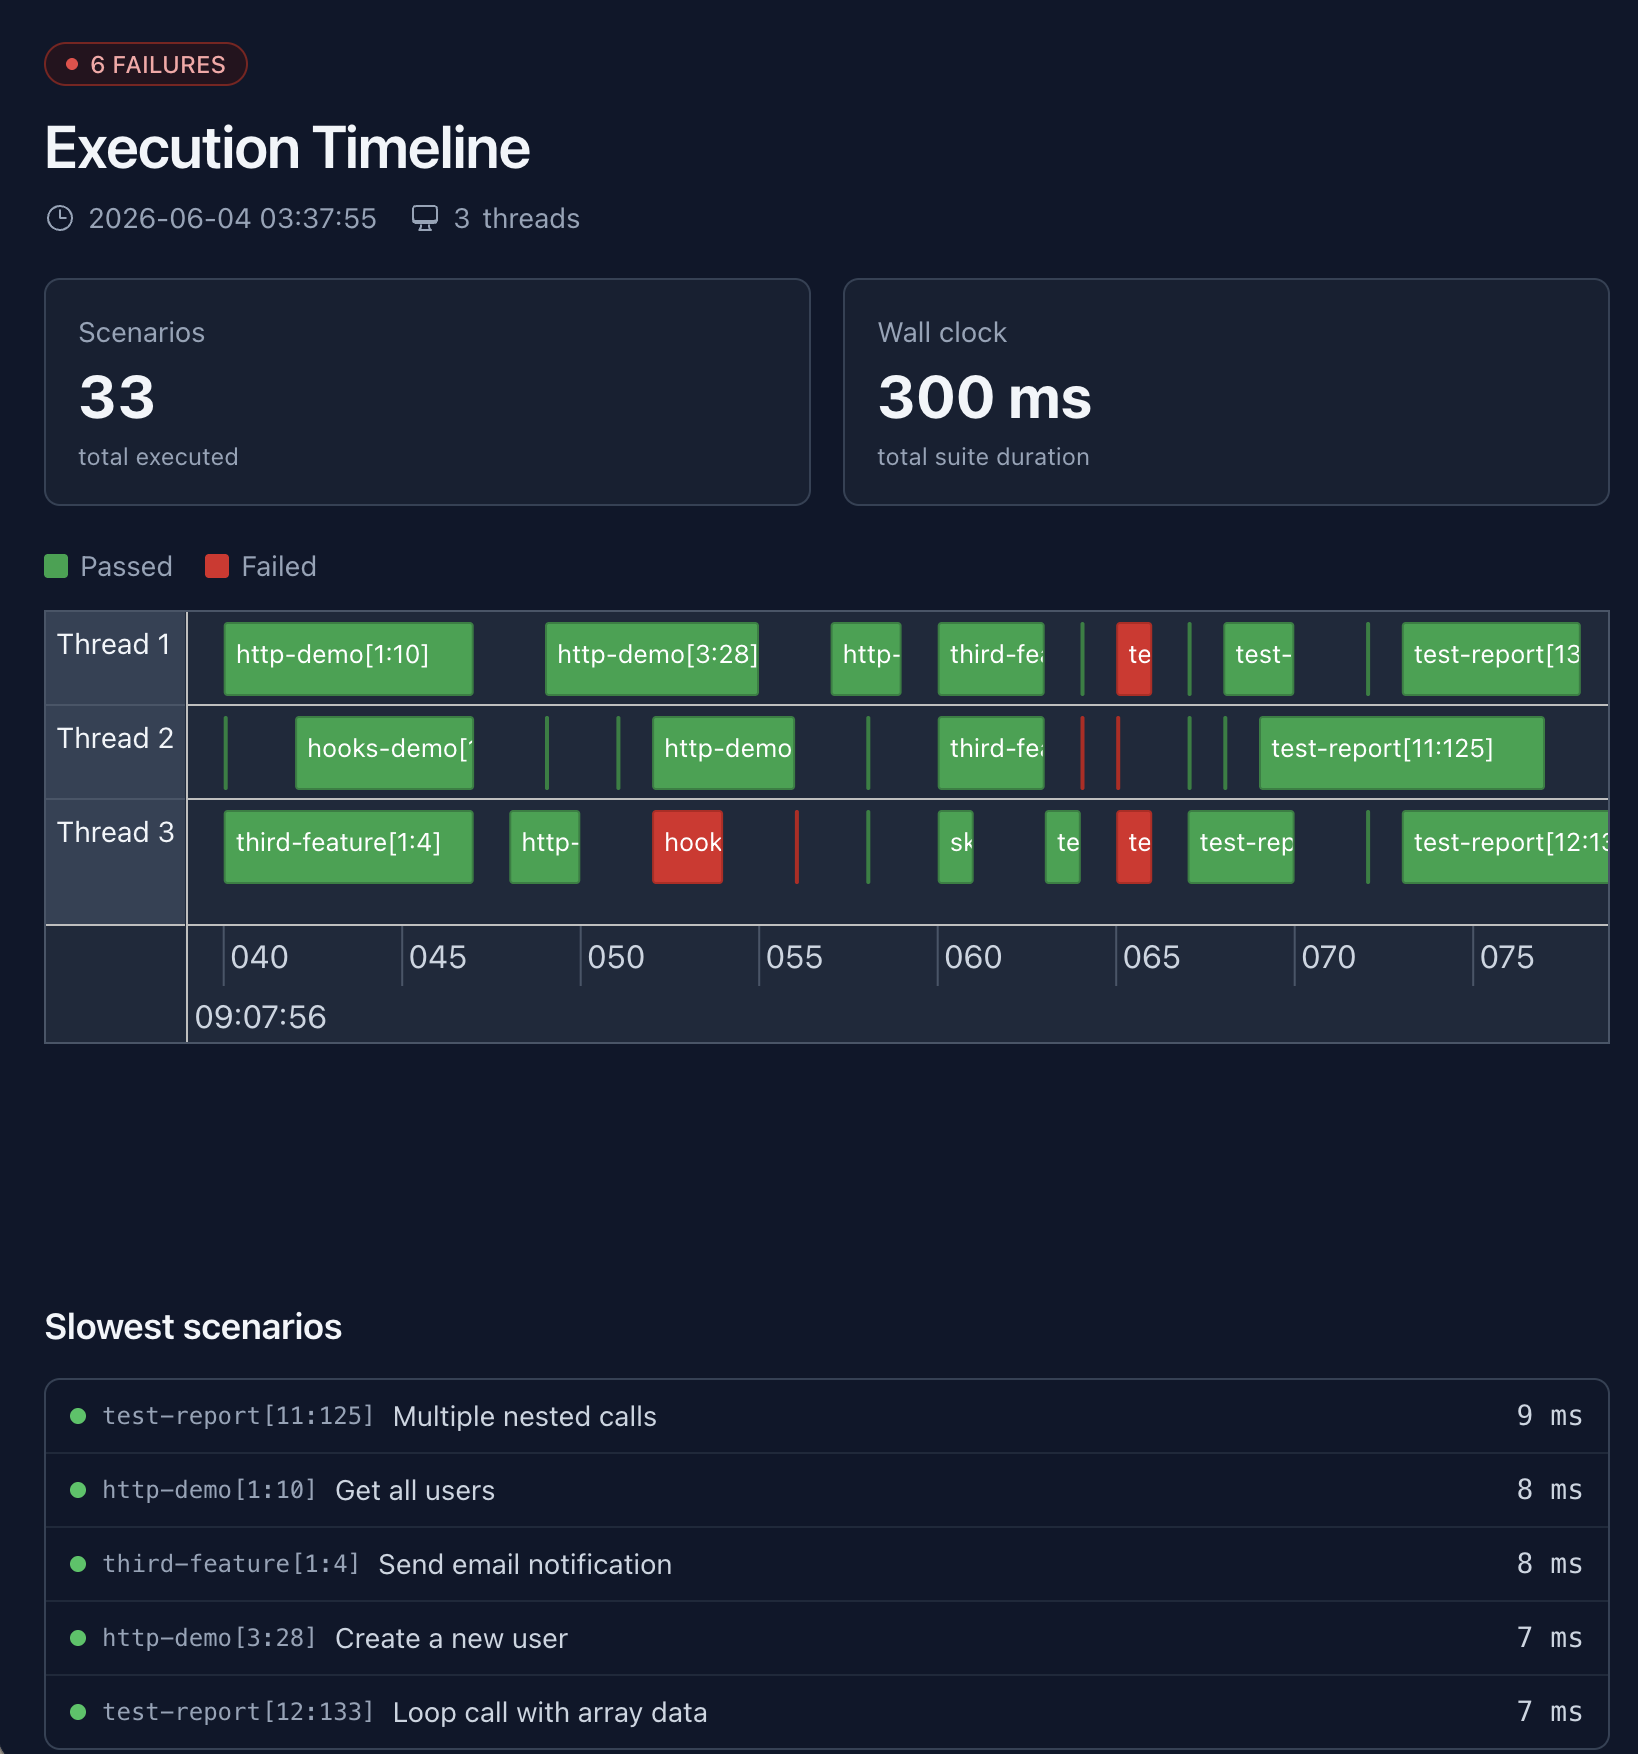
The timeline view (karate-timeline.html) is a Gantt of thread utilization across a parallel run:
JSON Lines event stream (karate-events.jsonl)
The structured-data feed designed for CI/CD scraping and live tailing by IDE integrations. One lifecycle event per line, flushed per write so external tools can read it as the run progresses:
{"type":"SUITE_ENTER","timeStamp":1747555200000,"threadId":null,"data":{"version":"2.0.8","env":"dev","threads":4}}
{"type":"FEATURE_ENTER","timeStamp":1747555200010,"threadId":"worker-1","data":{...}}
{"type":"SCENARIO_ENTER","timeStamp":1747555200020,"threadId":"worker-1","data":{...}}
{"type":"SCENARIO_EXIT","timeStamp":1747555200100,"threadId":"worker-1","data":{...}}
{"type":"FEATURE_EXIT","timeStamp":1747555200200,"threadId":"worker-1","data":{...full feature result...}}
{"type":"SUITE_EXIT","timeStamp":1747555210000,"threadId":null,"data":{"summary":{
  "featureCount":12,"featuresPassed":11,"featuresFailed":1,
  "scenarioCount":48,"scenariosPassed":47,"scenariosFailed":1,"scenariosSkipped":0,
  "passedRate":97,"durationMillis":9876,"passed":false
}}}
FEATURE_EXIT.data is the full FeatureResult.toJson() — every scenario, every step, every HTTP exchange. SUITE_EXIT.data.summary carries pass/fail counters, total duration, and a passedRate (integer percentage 0–100, or null when no scenarios executed). The same passedRate is also exposed per feature on FEATURE_EXIT.data so dashboards don't have to recompute it. Denominator is passedCount + failedCount (matching the HTML report's totals row); since @skipped is additive to passedCount, skipped scenarios are counted in both numerator and denominator.
Common jq recipes:
# Per-suite summary (drop into Slack/IM)
jq 'select(.type == "SUITE_EXIT") | .data.summary' \
   target/karate-reports/karate-json/karate-events.jsonl

# Just the failed features
jq 'select(.type == "FEATURE_EXIT" and .data.failed) | .data.name' \
   target/karate-reports/karate-json/karate-events.jsonl

# Slowest 5 scenarios across the run
jq -s '[.[] | select(.type == "FEATURE_EXIT") | .data.scenarioResults[]] | sort_by(-.durationMillis) | .[0:5]' \
   target/karate-reports/karate-json/karate-events.jsonl
Enable:
Runner.path("classpath:features")
    .outputJsonLines(true)
    .parallel(5);
karate run -f html,karate:jsonl features/
Cucumber JSON reports
Structured data for third-party Cucumber-aware tooling. One <feature-name>.json per feature in cucumber-json/:
Runner.path("classpath:features")
    .outputCucumberJson(true)
    .parallel(5);
karate run -f html,cucumber:json features/
JUnit XML reports
Standard JUnit <testsuite> / <testcase> shape, one XML per feature in junit-xml/. First-class <property> support for test management tools (Xray, Zephyr, qTest, TestRail) — see Test Management Integration below.
Runner.path("classpath:features")
    .outputJunitXml(true)
    .parallel(5);
karate run -f html,junit:xml features/
Report Location
Default Directory Structure
target/karate-reports/
├── karate-summary.html              # Summary dashboard (default)
├── karate-timeline.html             # Parallel-execution Gantt (default)
├── feature-html/                    # Per-feature interactive HTML (default)
├── karate-json/karate-events.jsonl  # JSON Lines event stream (opt-in)
├── cucumber-json/                   # Cucumber JSON, one per feature (opt-in)
└── junit-xml/                       # JUnit XML, one per feature (opt-in)
Custom Report Directory
SuiteResult results = Runner.path("classpath:features")
        .outputDir("build/custom-reports")
        .outputJunitXml(true)
        .outputCucumberJson(true)
        .parallel(5);
HTML Report Features
Console Output Access
After test execution, the console shows direct report links:
html report: (paste into browser to view)
-----------------------------------------
file:///project/target/karate-reports/karate-summary.html
Report Contents
HTML reports include:
- Execution summary - Pass/fail counts and timing
- Request details * headers, method, URL, body
- Response data - Status, headers, complete response
- Debug information * print statements and variables
- Performance metrics - Response times and efficiency
Timeline Analysis
Understanding Timeline Reports
The karate-timeline.html provides visual thread utilization:
Thread 1: |████████████████████| Feature A (2.1s)
Thread 2: |██████████████████  | Feature B (1.8s)
Thread 3: |███████████████████ | Feature C (1.9s)

Efficiency: 85% (good utilization)
Key metrics:
- Thread utilization - How well threads are used
- Feature distribution - Load balancing across threads
- Performance bottlenecks - Slow tests that block others
CI/CD Integration
Jenkins Configuration
Configure Jenkins to publish Karate reports. Enable JUnit XML in your runner so Jenkins can pick up per-test results:
pipeline {
    stages {
        stage('Test') {
            steps {
                sh 'mvn test'
            }
            post {
                always {
                    publishHTML([
                        reportDir: 'target/karate-reports',
                        reportFiles: 'karate-summary.html',
                        reportName: 'Karate Reports'
                    ])
                    junit 'target/karate-reports/junit-xml/*.xml'
                }
            }
        }
    }
}
GitHub Actions Configuration
- name: Run tests
  run: mvn test

- name: Publish test results
  uses: dorny/test-reporter@v1
  if: always()
  with:
    name: Karate Test Results
    path: target/karate-reports/junit-xml/*.xml
    reporter: java-junit

- name: Upload HTML reports
  uses: actions/upload-artifact@v4
  if: always()
  with:
    name: karate-reports
    path: target/karate-reports/
Report Configuration
Enabling Multiple Formats
@Test
void comprehensiveReporting() {
    SuiteResult results = Runner.path("classpath:features")
            .outputJunitXml(true)          // For CI/CD
            .outputCucumberJson(true)      // For dashboards
            .outputHtmlReport(true)        // For debugging (default)
            .outputDir("target/ci-reports")
            .parallel(8);

    assertFalse(results.isFailed());
}
Report Verbosity Control
Two complementary knobs:
configure logging = { report: '<level>' }— raise the threshold to drop INFO entries (print,karate.log, HTTP bodies) from captured logs. See Logging.@report=false— hide an entire scenario from HTML / Cucumber JSON / JUnit XML / JSONL outputs (it still runs and counts toward suite totals; failures surface a redacted message).
Feature: Report configuration

# Quiet warmup — no captured INFO output, but request still runs
Scenario: minimal logging
  * configure logging = { report: 'warn' }
  * url 'https://api.example.com'
  * path 'health'
  * method get

# Tagged scenario — entirely hidden from artifacts
@report=false
Scenario: warmup with sensitive credentials
  * call read('classpath:auth/login.feature')
For HTTP body redaction (mask Authorization, password fields, bearer tokens, etc.) see Logging > Masking sensitive data.
Third-Party Integration
Cucumber Reporting Plugin
Generate enhanced reports using Maven plugin:
<plugin>
    <groupId>net.masterthought</groupId>
    <artifactId>maven-cucumber-reporting</artifactId>
    <version>5.7.2</version>
    <executions>
        <execution>
            <phase>verify</phase>
            <goals>
                <goal>generate</goal>
            </goals>
            <configuration>
                <projectName>API Test Suite</projectName>
                <outputDirectory>target/cucumber-reports</outputDirectory>
                <inputDirectory>target/karate-reports/cucumber-json</inputDirectory>
                <jsonFiles>
                    <param>*.json</param>
                </jsonFiles>
            </configuration>
        </execution>
    </executions>
</plugin>
Test Management Integration (Xray, Zephyr, qTest, TestRail)
Karate's JUnit XML output emits scenario tags as <property> elements inside <testcase><properties>, the format that Jira-based test management tools (Xray, Zephyr, qTest, TestRail) and reporting platforms (ReportPortal, Allure) parse to link test runs back to requirements, test keys, labels, and custom fields.
Tag → JUnit property mapping
| Karate tag | JUnit XML output |
|---|---|
@requirements=ABC-1,ABC-2 | <property name="requirements" value="ABC-1,ABC-2"/> |
@test_key=CALC-100 | <property name="test_key" value="CALC-100"/> |
@test_summary=Login happy path | <property name="test_summary" value="Login happy path"/> |
@smoke @api (plain tags) | one <property name="tags" value="@smoke,@api"/> |
The rule is simple: tag of the form @key=v1,v2 becomes <property name="key" value="v1,v2"/> — so any property name your test management tool recognizes works without configuration. Plain tags (no =) aggregate into a single comma-separated tags property.
Xray (Jira)
Xray reads these property names inside <testcase>:
requirements/requirement— Jira issue keys to link the test run to (comma-separated)test_key— Xray test-issue key (existing test in Jira)test_id— Xray internal idtest_summary,test_description— overrides for the imported testtags— labels applied to the Jira issuetr:<field>— test-run custom field (e.g.tr:browser,tr:env)
@test_key=CALC-100 @requirements=REQ-42,REQ-43 @smoke
Scenario: Login happy path
  Given url 'https://api.example.com/login'
  And request { username: 'alice', password: '#(secret)' }
  When method post
  Then status 200
Run with JUnit XML enabled, then import to Xray:
Runner.path("classpath:features")
    .outputJunitXml(true)
    .parallel(5);
curl -H "Authorization: Bearer $XRAY_TOKEN" \
     -F "file=@target/karate-reports/junit-xml/login.xml" \
     https://xray.cloud.getxray.app/api/v2/import/execution/junit
Zephyr Scale, qTest, TestRail
The same approach works — just use the property names your tool expects. For example, Zephyr Scale reads test_key for existing test cases; qTest reads requirements and custom field properties.
ReportPortal & Allure
For richer integrations (screenshots, attachments, real-time progress), use the JSON Lines event stream instead — see the JSON Lines event stream section above. Karate also generates Cucumber JSON which Allure consumes natively via allure-cucumber-jvm.
Quick reference
# Link to Jira requirements (Xray, qTest)
@requirements=PROJ-1,PROJ-2

# Bind to an existing test issue (Xray, Zephyr)
@test_key=PROJ-100

# Override the imported test summary
@test_summary=User can reset password via email link

# Custom run fields (Xray)
@tr:browser=chrome @tr:env=staging

# Plain labels (apply to the Jira issue)
@smoke @regression
Common Gotchas
- Missing reports: Check if tests actually executed
- Large report files: Raise
configure logging = { report: 'warn' }to drop INFO captures, or tag noisy fixtures@report=false. See Logging. - Broken report links: Use relative paths and proper directory structure
- CI report access: Ensure proper artifact archiving in CI/CD pipelines
Next Steps
Master test reporting for effective debugging and monitoring:
- Logging — control verbosity, redact secrets, hide scenarios from artifacts
- CI/CD — publish reports to GitHub Pages, scan for leaked secrets
- Debugging — use reports for effective troubleshooting
- Parallel Execution — optimise performance with timeline analysis
- Command Line — generate reports from command-line execution